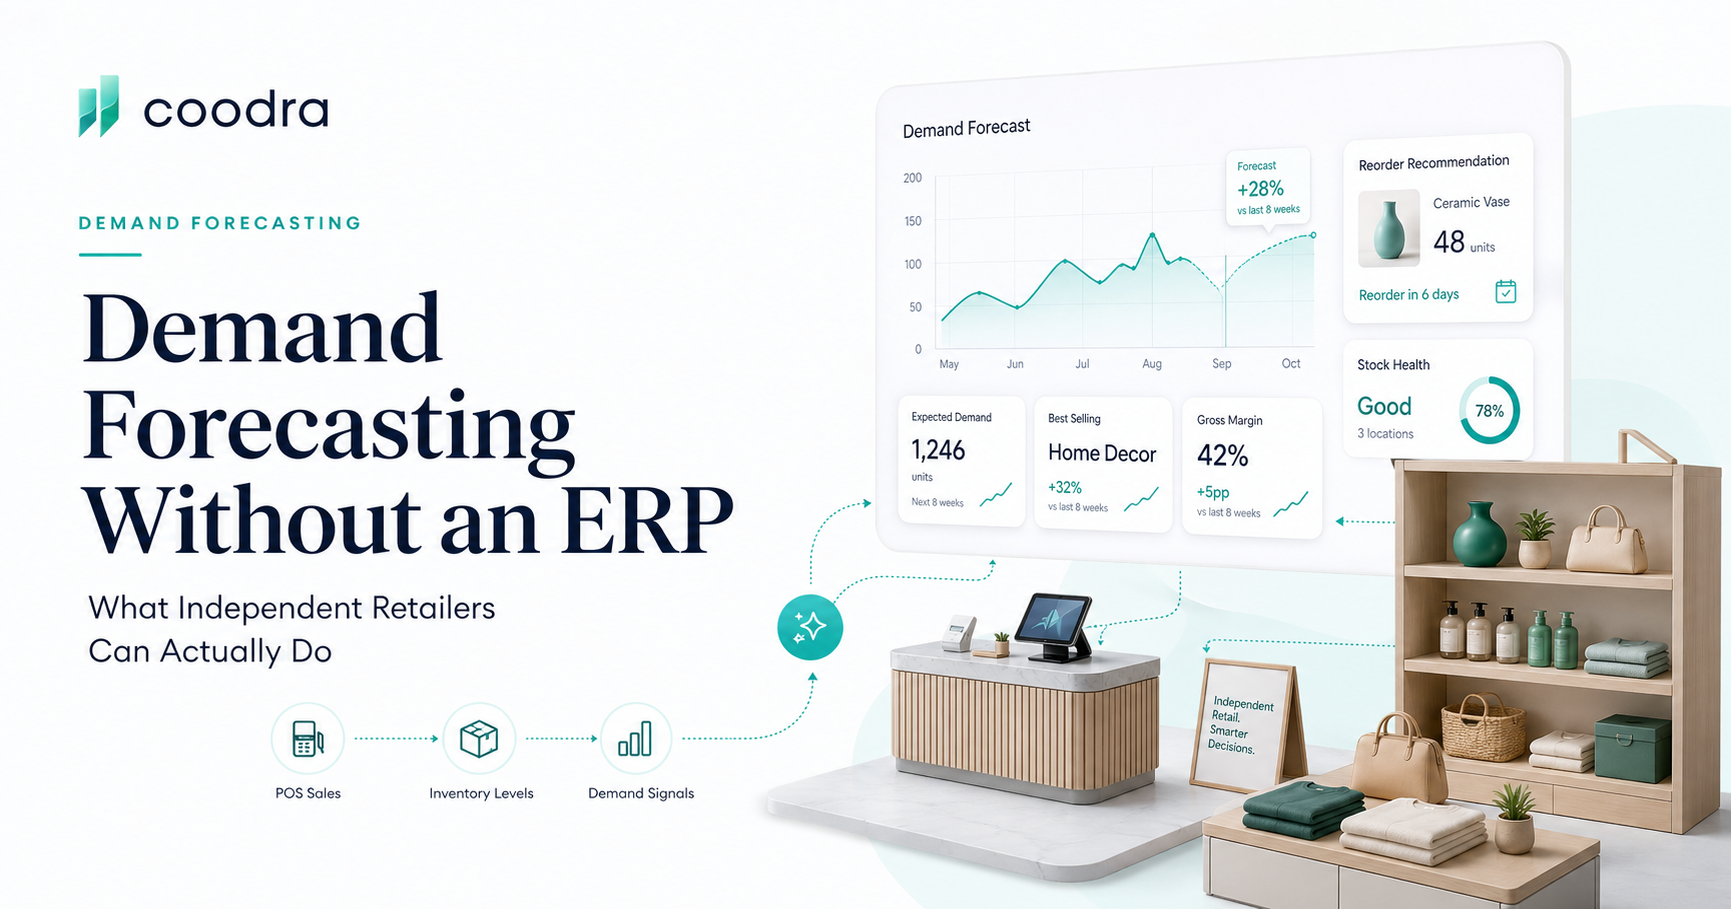
Demand Forecasting Without an ERP: What Independent Retailers Can Actually Do
Most inventory forecasting tools assume you have an ERP, a data team, and years of clean records. Here is what independent retailers can do with the data they already have.
Michael Shahid • Founder & CEO
Most inventory forecasting tools were designed for companies that already have ERP systems. The pitch is compelling: let our software predict your demand, automate your replenishment, and eliminate stockouts. What the pitch leaves out is the prerequisite: you need clean, structured, historical data that most independent retailers do not have.
If you run a jewelry store, a pet supply shop, or a specialty grocery, you probably do not have 24 months of organized SKU-level sell-through data. You have your POS data — pulled from Shopify, Square, Lightspeed, or Clover — and whatever you have manually tracked in spreadsheets. That is not nothing. But it is also not an ERP.
Here is the good news: you do not need an ERP to forecast demand better than you currently are. You need two things. Enough clean signal. And a consistent process to review it.
Demand forecasting for independent retailers without an ERP: what actually works with POS data alone
The ERP assumption gap in inventory software
The gap between what enterprise forecasting tools expect and what independent retailers actually have is significant. ERP systems maintain continuous, SKU-level inventory and sales records with accurate cost data, supplier lead times, and seasonal adjustments. Most independent retailers have none of that in a structured form.
When you buy a forecasting tool that assumes ERP data, you end up spending the first three months cleaning up imports, correcting SKU mismatches, and building the infrastructure the software was designed to work with. By the time you are ready to forecast, you have spent more time on data preparation than on any actual decision.
Coodra was built to work with POS and commerce data directly — Shopify, Square, Lightspeed, Clover, and WooCommerce — without requiring a data team or a months-long onboarding. See how the POS connection works.
Signal 1: Weekly sales velocity per SKU
The foundation of any demand forecast — ERP or no ERP — is a reliable weekly sales velocity per SKU. Not last month's total. Not what you vaguely remember selling. Weekly velocity: units sold per SKU per week, calculated over a rolling 4-to-6-week window.
This is the number that tells you what demand actually looks like right now, not three months ago. A SKU that averaged 3 units a week over the last month is in a different demand position than one that averaged 3 units a week over the last quarter — the recent window matters more for planning the next reorder.
Coodra calculates this automatically for every SKU in your POS, updated weekly. See the demand signals Coodra surfaces for every product.
Signal 2: Seasonal position — same period last year
Most independent retailers skip seasonal analysis because they think it requires statistical expertise. It does not. It requires pulling the same period from last year.
What did you sell in April last year? Your POS almost certainly has that data. Compare it to this April. If you sold 140 units in April 2025 and 115 units in April 2026, that is a 18% demand decline in the same seasonal period — not explained by a one-time promotion or a new competitor opening. That is signal worth acting on before you place your next purchase order.

You do not need a statistical model for this. You need last year's POS report and a basic spreadsheet. The model is a comparison. The insight is whether your current year is tracking above, below, or in line with last year's seasonal pattern.
Signal 3: Category-level trend direction
SKU-level forecasting is noisy for low-velocity products. If you sell 3 units of a SKU per week, any single week's data is almost random. Category-level trends are more stable and more useful for high-level buying decisions.
If your accessories category is running 12% ahead of last year while your jewelry category is running 4% behind, that is meaningful signal for how to allocate your next purchase budget — even without knowing exactly which specific SKU within jewelry is underperforming.
Coodra tracks category-level performance automatically and flags when a category is trending meaningfully above or below its prior-year position.
The real reason demand forecasting fails: lead time
Most demand forecasting mistakes are not actually forecasting errors. They are lead-time errors. When you place a purchase order with a 3-week lead time, you are not forecasting what demand looks like right now. You are forecasting what demand will look like 3 weeks from now. Most retailers are accidentally forecasting their current inventory position — what they think they have on hand — rather than what demand will do while they wait for the order to arrive.
The fix is not a better forecast. It is knowing your true replenishment cycle: how long from order to receipt, including the time it takes to process, receive, and put away stock. If your effective lead time is 4 weeks and your safety stock only covers 1 week, you are under-buffered for every single reorder cycle, guaranteed. This is the lead-time gap and it is more common than any forecasting error.
Coodra calculates per-SKU safety stock based on your actual lead time and your sales velocity — automatically, from your POS data. See how the reorder point calculation works.
The 90-day demand baseline
If you only have one number to track, track a 90-day rolling average of weekly sales per SKU. Ninety days smooths out the noise from a single slow week or a promotional spike, while still being recent enough to reflect actual demand trends rather than seasonal patterns that may have shifted.
Thirty days is too short for most retail products — one slow week can make a 2-unit-per-week SKU look like a 1-unit-per-week SKU. Six months is too long if you have changed your product mix, moved locations, or had a competitor open nearby.
The 90-day average is most reliable for products that sell at least 4 units per week consistently. For slower-moving SKUs, your signal-to-noise ratio is lower regardless of what tool you use. The practical advice: track it, but trust it less, and lean toward supplier minimums as your reorder quantity.
This is not a perfect system. No demand forecast is. But it is better than reordering on instinct, and it is more reliable than extrapolating from a single month of data. The gap between what independent retailers are doing now and what they could be doing with this approach is significant.
Coodra builds a 90-day demand baseline automatically from your POS data and uses it to generate reorder recommendations that account for lead time, seasonal position, and velocity trend — without requiring an ERP, a data team, or a manual spreadsheet. Apply for early access.
Primary sources
Was this helpful?