The Stock-to-Sales Ratio: The Simple Metric Most Independent Retailers Skip
It tells you how many days of inventory you have on hand at any given time. Lower is better. Most retailers do not track it — and pay for it in margin.
Michael Shahid • Founder & CEO
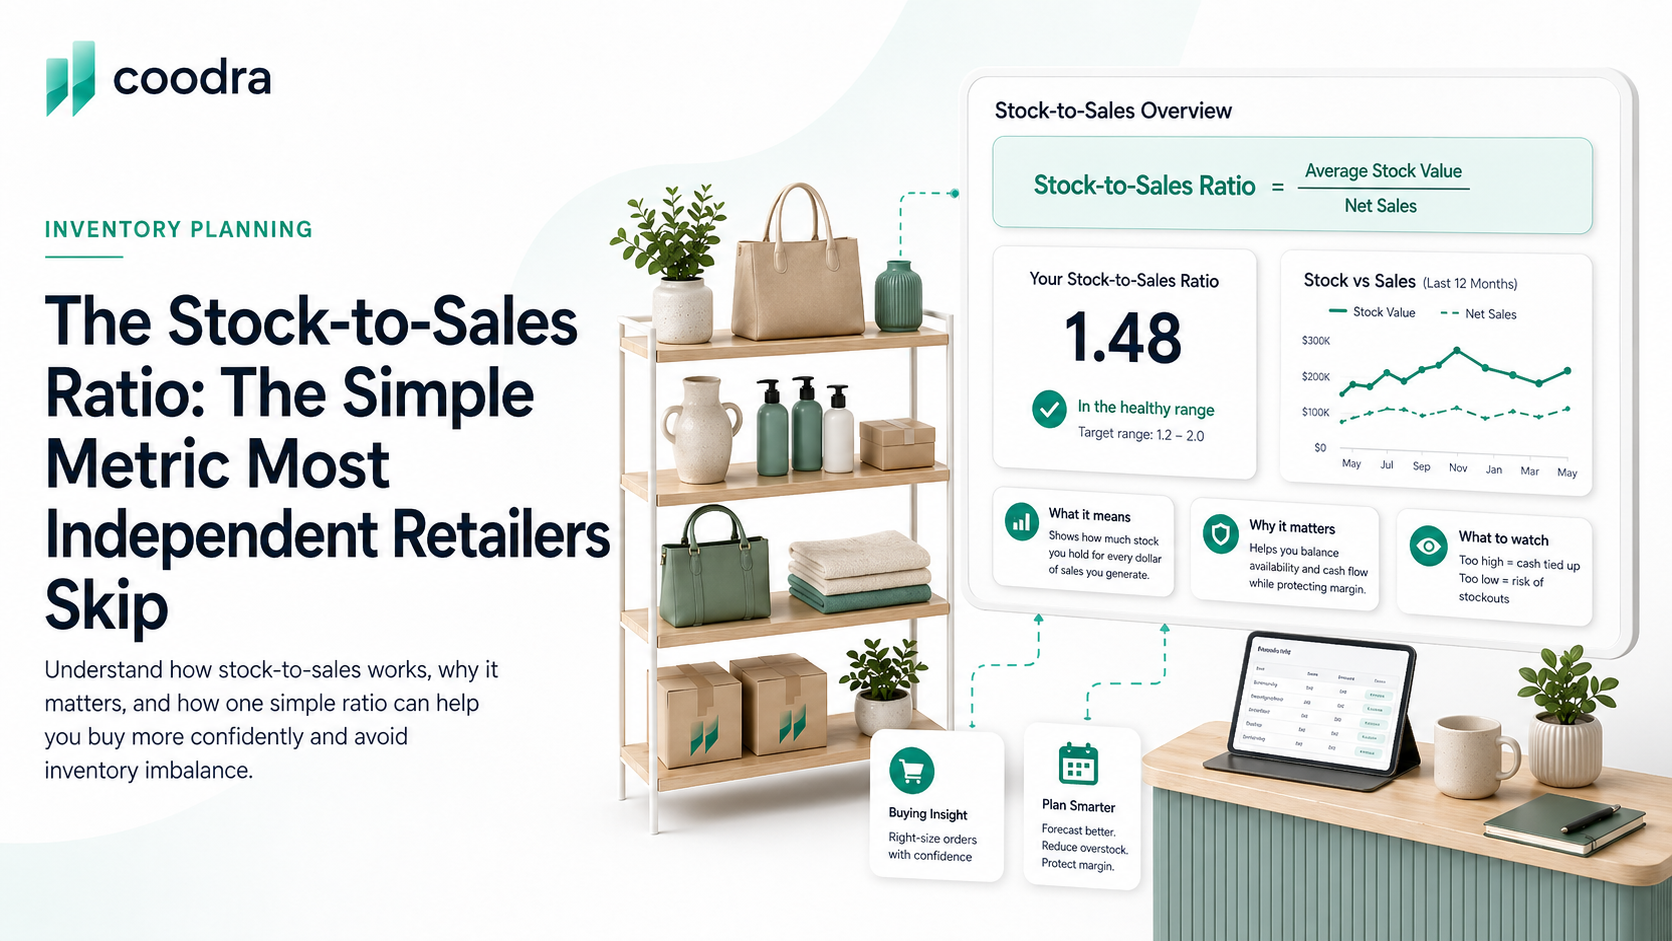
The stock-to-sales ratio is one of the simplest and most useful metrics in retail. It answers one question: how long does inventory sit in my store before it sells? Lower is better — because inventory that sits ties up capital, takes up shelf space, and eventually forces a discounted clearance.
Most independent retailers do not track it. They track sell-through in vague terms ("we moved a lot of that") and they track inventory levels in the same vague terms ("we have a lot of that in the back"). The stock-to-sales ratio makes the conversation precise.
How to calculate it
Stock-to-Sales Ratio = Average Inventory on Hand ÷ Net Sales (units or dollars)
To get your average inventory on hand: take the beginning and ending inventory count for a period (your POS can give you this), add them, divide by 2. Then divide your net sales for that period by that average.
The result is a multiplier. A ratio of 2.0x means you have approximately twice your average weekly sales in inventory on hand — or about 14 days of supply at current velocity. A ratio of 4.0x means you have roughly 28 days of supply. The higher the number, the longer inventory sits.
What the numbers mean in practice
For most specialty retail categories, a healthy stock-to-sales ratio is between 1.5x and 2.5x — meaning you have roughly 10-18 days of supply on hand at any given time. This is low enough that inventory is turning fast and you are not holding excess, but high enough that you have buffer to handle a week of unexpectedly strong traffic.
A ratio between 2.5x and 4.0x is a caution zone. Inventory is sitting longer than ideal. You are probably ordering too much relative to your sell-through rate. At this ratio, you want to start reducing order quantities and watching for products that are clearly dead weight.

A ratio above 4.0x is a danger zone. This is where dead stock compounds. You are holding more than four weeks of supply, which means you have products on your shelves that are not selling at a rate that justifies the capital. At this ratio, markdowns are coming, and they will hurt more because the inventory has been sitting long enough that it may be seasonally stale by the time you clear it.
Five signs your store has too much dead inventory — including what to look for before the ratio climbs this high.
Calculate it by category, not just store-wide
A store-wide ratio hides problems. Your overall stock-to-sales might be 2.2x — healthy — while your jewelry category is at 5.1x and your accessories category is at 1.1x. The store-wide number makes the jewelry problem invisible.
Calculate the ratio by category every 4 weeks. This is where the metric becomes genuinely actionable. A category running at 4.5x tells you to reduce incoming orders on that category, accept that some markdowns may be coming, and stop buying at the same rate until the ratio improves.
The connection to buying decisions
Your stock-to-sales ratio should directly influence your purchase order size. When you are entering a new season or receiving a new shipment, look at your current ratio by category before confirming the order. If the category is already at 3.5x, adding more inventory will push it higher. The smarter move is to wait — let the existing inventory turn before adding more.
This is the discipline that separates retailers with healthy cash flow from retailers who are constantly over-extended on inventory. It is not about buying less. It is about buying at the right time in the cycle.
Coodra tracks your stock-to-sales ratio per category automatically and flags when a category drifts into the caution or danger zone — before it becomes dead stock. See it connected to your POS data.
Primary sources
Was this helpful?