How to Read Your POS Data to Make Smarter Buying Decisions
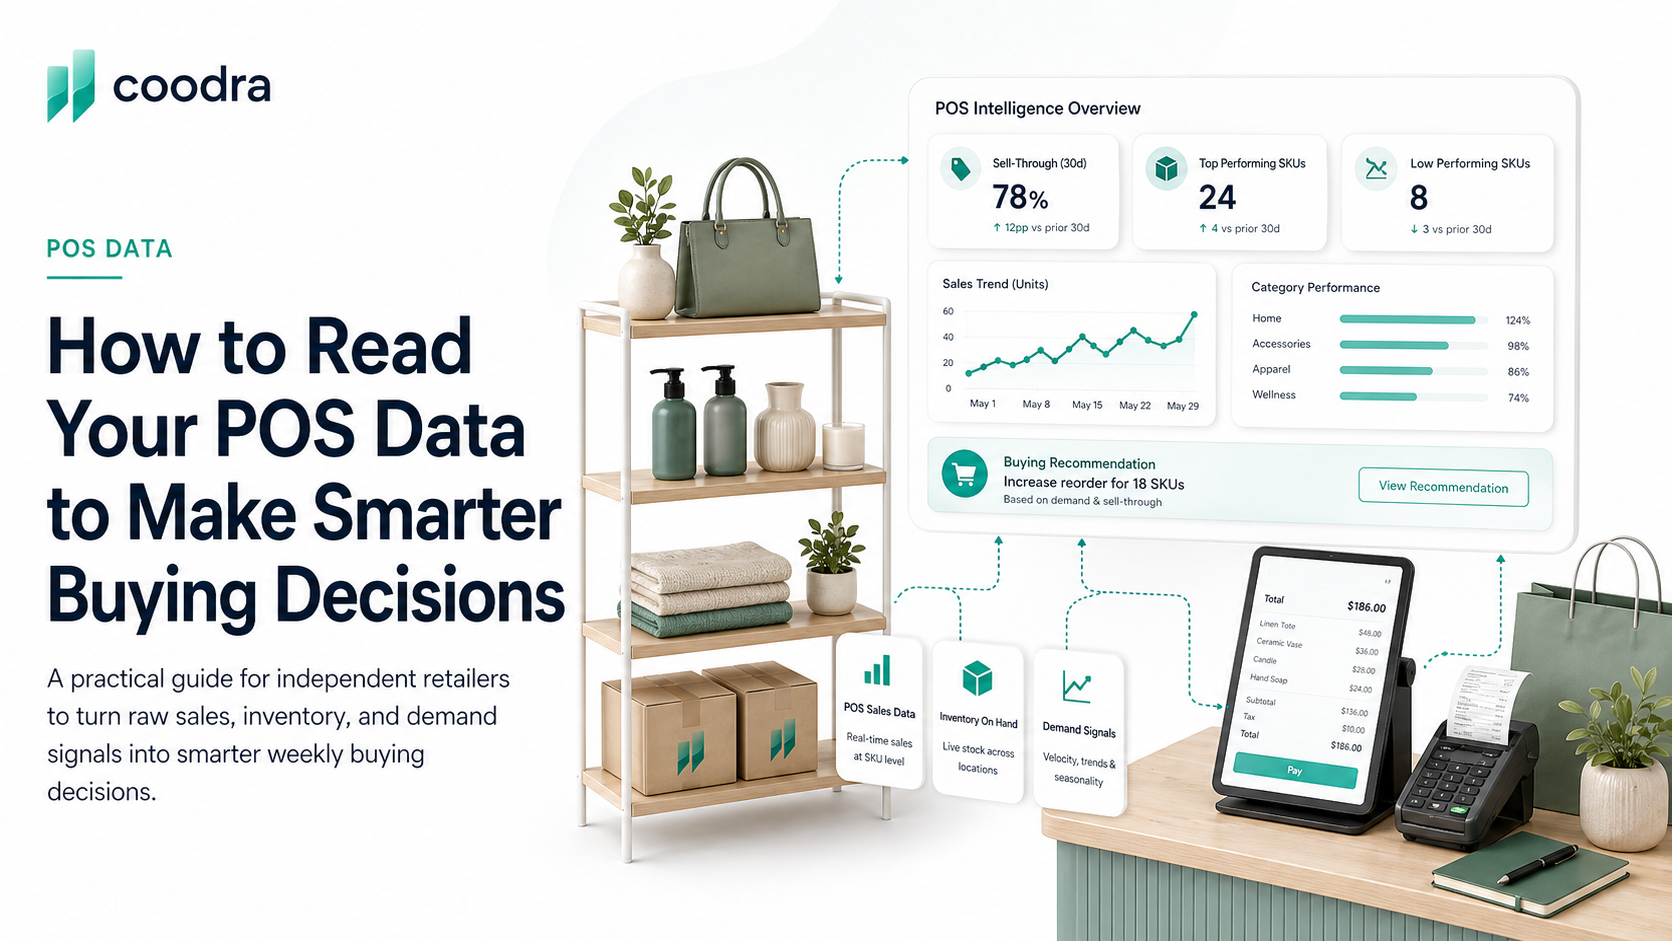
Your POS logs everything you need — sales velocity, stock position, demand trends. Here is how to turn transaction data into a weekly buying strategy without a spreadsheet.
Michael Shahid • Founder & CEO
Every transaction your POS processes is a data point. Most independent retailers never look at it beyond confirming the sale went through. That is a significant missed opportunity — because the data your POS generates every week contains everything you need to make better, more confident buying decisions.
This is not about building dashboards. It is about knowing which five questions to ask your POS data every week, and knowing where to find the answers.
The five questions your POS can answer every week
These are the questions that separate retailers who manage inventory by instinct from retailers who manage it by data. You do not need a BI tool or a spreadsheet to answer any of them — most POS systems surface all of this in their reporting sections.
Question 1: What sold the most, compared to last week and last month?
Most POS systems have a "top sellers" or "sales by item" report. Run it for the last 7 days and compare it to the prior 7-day period. Look for products that have moved into the top 20% by units sold — that is a velocity signal. It means something changed: a new customer type found it, a display drove attention, or seasonal demand shifted.
Acting on this signal does not mean doubling your order. It means making sure you do not under-order the same product this cycle and run out at the worst moment. Coodra tracks this automatically every week and flags products that are trending up before you miss a reorder window. For a full list of velocity signals to watch, see the five signs your store has too much dead inventory.
Question 2: What is my current stock position per SKU, and which SKUs are below my reorder point?
Your POS knows your on-hand inventory by SKU. The question is whether you are checking it before you reorder. Most retailers order when the shelf is empty — not when the data says it will be empty in 10 days.
The fix: run an inventory by item report once a week. Sort by quantity on hand, ascending. The SKUs at the bottom are your most urgent replenishment needs. Cross-reference with your sales velocity — a SKU at 10 units with a 3-unit-per-week velocity needs a reorder now. A SKU at 10 units with a 0.5-unit-per-week velocity does not.
How to calculate reorder points without a spreadsheet — and how to apply them consistently across your top SKUs.
Question 3: Which products sold faster this week than the prior 4-week average?

This is a demand trend question. One week is noisy. Four weeks gives you a pattern. Products selling at twice their 4-week average are telling you something: a trend is forming, or a supply constraint is about to bite.
Acting on this signal early — before the shortage becomes a stockout — is one of the highest-value inventory decisions you can make. The retailers who never run out of their best sellers are the ones who are watching velocity trends, not just stock counts.
Question 4: What is my sell-through rate by category?
Sell-through rate = units sold ÷ units received in a given period. Run this by category — not by total store — every 4 weeks. It tells you which categories are performing and which are accumulating inventory relative to the volume you are bringing in.
A category with a 15% sell-through over 30 days is a warning sign: you are bringing in far more than you are moving. A category with a 60% sell-through is healthy — inventory is turning and you are likely not holding excess. The stock-to-sales ratio is another way to track the same signal — and works especially well for monitoring category health at a glance.
This question is especially important before you place a large purchase order. If a category has been trending at 20% sell-through, adding more inventory will not fix it. See how Coodra surfaces category health every week.
Question 5: What is my best-seller mix by revenue versus by units?
These are different lists. Your top sellers by units might be low-ticket items — a $5 accessory that moves 20 units a week. Your top sellers by revenue might be $200 pieces that move 2 units a week. Both matter. But they tell you different things.
The units list tells you what drives traffic and repeat visits. The revenue list tells you what pays the bills. A healthy store has products in both lists. If your revenue list is full of items that are also your slowest movers by velocity, you have a margin mix problem that no amount of traffic will solve.
The weekly review does not need to take more than 20 minutes. Pull the five reports above, note the three most important changes, and act on the one decision that has the highest margin impact. That is the discipline. Everything else is detail.
Coodra consolidates all five questions into a single weekly view — your top movers, your reorder flags, your slow categories, and your velocity trends — pulled automatically from your POS. Apply for early access and get the weekly view without running a single report manually.
If you are evaluating whether your POS data is clean enough to trust for these decisions, this guide covers how to assess signal quality before you act on any single data point.
Primary sources
Was this helpful?